
前書き
仕事でvCenterServerのデータをPrometheusで収集してGrafanaで表示する・・・というタスクをもらったので備忘がてらその方法を記録する。
今回はCentOSにPrometheus(プロメテウス)とGrafana(グラファナ)をインストールするところから。
環境
CentOS 7.9 ※最小インストール
Prometheus 2.27.1
Grafana 7.1.5 または 7.5.7 ※どっちもやったけどどっちも同じ手順でOK
本環境では、PrometheusとGrafanaは同じサーバーにインストールする。
また、サーバー再起動しても自動でサービスが立ち上がるように自動起動用のスクリプトをあわせて作成する。
なお、本環境はサーバーがインターネットにアクセス可能であることを前提とする。
環境によってはプロキシ経由にしたりローカルに落とすなどの対応が必要なので留意されたし。
CentOSの入手
以下サイトよりISOをダウンロードする。

左側の「CentOS Linux」から自身の環境にあったバージョンとものを選択する。
私の環境では、ESXi上の仮想マシンにCentOS7.9をインストールするので、「7(2009)」を選択してからISOの「x86_64」を選択する。


ダウンロード元一覧が表示されるので、適当に選択する。(どれも中身は一緒)

クリックするとIndexが表示されるので「CentOS-7-x86_64-Minimal-2009.iso」を選択して適切な場所に保存する。
※Minimal(最小インストール)じゃなくても勿論良い

CentOSのISO入手方法は以上である。
各々の環境に合わせてデプロイを行ってほしい。
Prometheusのインストール
サーバー(CentOS)の準備が出来たら、Prometheusのインストールを行う。
Prometheusのtarを入手して解凍していくことになるが、Prometheusのリリース状況は以下で確認することが可能。
今回はv2.27.1なので、入手先のURLは以下になる。(後ほどwgetで指定する)
https://github.com/prometheus/prometheus/releases/download/v2.27.1/prometheus-2.27.1.linux-amd64.tar.gz
Prometheus用のポート開放
Prometheusはポート9090へListenするので予め開放しておく。
firewall-cmd --add-port=9090/tcp --zone=public --permanent
firewall-cmd --reload
firewall-cmd --list-ports --zone=public
Prometheus Serverのインストールと起動スクリプトの作成
続いて、先程確認したPrometheusのインストールを行う。
Prometheusのインストールにはwgetコマンドを利用する。
但しCentOSの最小インストールではwgetコマンドがないので、予めwgetコマンドをyumでインストールする。
Prometheusのインストール後、サーバー再起動後もPrometheusを自動起動させるためのスクリプトを作成/設定する。
wgetコマンドのインストール
yum install wgetPrometheus Serverのインストール
cd /usr/local/src
wget https://github.com/prometheus/prometheus/releases/download/v2.27.1/prometheus-2.27.1.linux-amd64.tar.gz
tar zxvf prometheus-2.27.1.linux-amd64.tar.gz
cd prometheus-2.27.1.linux-amd64
Prometheus自動起動用のスクリプト作成(prometheus.serviceとする)
vi /usr/lib/systemd/system/prometheus.serviceprometheus.serviceの中身を以下にする。
[Unit]
Description=Prometheus - Monitoring system and time series database
Documentation=https://prometheus.io/docs/introduction/overview/
After=network-online.target

[Service]
Type=simple
ExecStart=/usr/local/src/prometheus-2.27.1.linux-amd64/prometheus \
  --config.file=/usr/local/src/prometheus-2.27.1.linux-amd64/prometheus.yml \

[Install]
WantedBy=multi-user.target
作成した自動起動用スクリプトを読み込ませ、自動起動を有効にし、最後にサービスを起動する。
systemctl daemon-reload
systemctl enable prometheus.service
systemctl start prometheus.service
以下URLを入力し、PrometheusのGUI画面が表示されていればOK
http://xxx.xxx.xxx.xxx:9090/
※xxx.xxx.xxx.xxxはPrometheusをインストールしたサーバーのIPアドレスを入力する。

Prometheusのインストール方法及び設定は以上である。
Grafanaのインストール
Prometheusのインストールが終わったら、今度はGrafanaのインストールを行う。こちらはかなり簡単。
Grafanaのリリース状況は以下から確認する。
また、「Download page」のリンク先から各バージョンのダウンロード方法を確認できる。


今回はGrafana7.1.5とする(すでに割と古いバージョン。これは勤め先のバージョンがこれだからというだけ)
Grafana用のポート開放
Grafanaはポート3000へListenするので予め開放しておく。
firewall-cmd --add-port=3000/tcp --zone=public --permanent
firewall-cmd --reload
firewall-cmd --list-ports --zone=public
Grafanaのインストールと自動起動設定
続いて、先程確認したGrafanaのインストールを行う。
合わせて自動起動設定を行う。こちらは自動起動用のスクリプトの作成は不要。
cd /usr/local/src
wget https://dl.grafana.com/oss/release/grafana-7.1.5-1.x86_64.rpm
yum install grafana-7.1.5-1.x86_64.rpm
systemctl enable grafana-server
systemctl start grafana-server
以下URLを入力し、GrafanaのGUI画面が表示されていればOK
http://xxx.xxx.xxx.xxx:3000/
※xxx.xxx.xxx.xxxはGrafanaをインストールしたサーバーのIPアドレスを入力する。
初期ユーザーIDと初期パスワードは admin / admin である。

Grafanaのインストールは以上である。
試しにGrafanaでPrometheusの情報を取得してみる。
ここまで設定が正しく出来ていれば、PrometheusのTargetページでPrometheus自身の監視を行っているはず。Status→Targetsの中の「prometheus」がupしていればOK。


これを踏まえて、Grafanaでprometheusが取得している情報を表示してみる。
GrafanaのDatasourceにPrometheusを追加する
PrometheusのデータをGrafanaで表示させるには、まずGrafanaのDatasource(データソース)としてPrometheusを追加してやる必要がある。データソースの追加はGrafanaログイン後「Configuration」の「Data Sources」から行う。

Add data sourceをクリックする

Prometheusを選んで「Select」をクリックする。

対象Prometheusの各種情報を求められるので、入力していく。最低限入力必須なのはURLぐらいである。もし複数のPrometheusから情報を収集する予定があるならば、どのPrometheusかわかる名前にNameを変えておいても良い。

入力が完了したら「Save & Test」をクリックする。

このようにData SourcesにPrometheusが追加されていればOK。

ダッシュボードを作成する
Datasourceの追加が出来たら、ダッシュボードを作成する。「Create」→Dashboardから新規ダッシュボードの作成を行う。

Add empty panel をクリックする。

「Query」タブでデータソースとして先程追加したPrometheusを指定してやる。

次に、Aというアイテムの下にある「Metrics」というプルダウンメニューを開いてみる。
色々候補が出ると思うが「prometheus」を選択するとPrometheus自身の監視情報(メトリックという)を選ぶことができる。
試しに「prometheus_build_info」を選択してみる。

すると、こんな画面になるはず。
prometheus_build_infoはデータソースとなっているPrometheusのバージョン情報を取得しているアイテムなので、先程インストールしたprometheusのバージョン情報がラベル(label)値として表示されているはず。
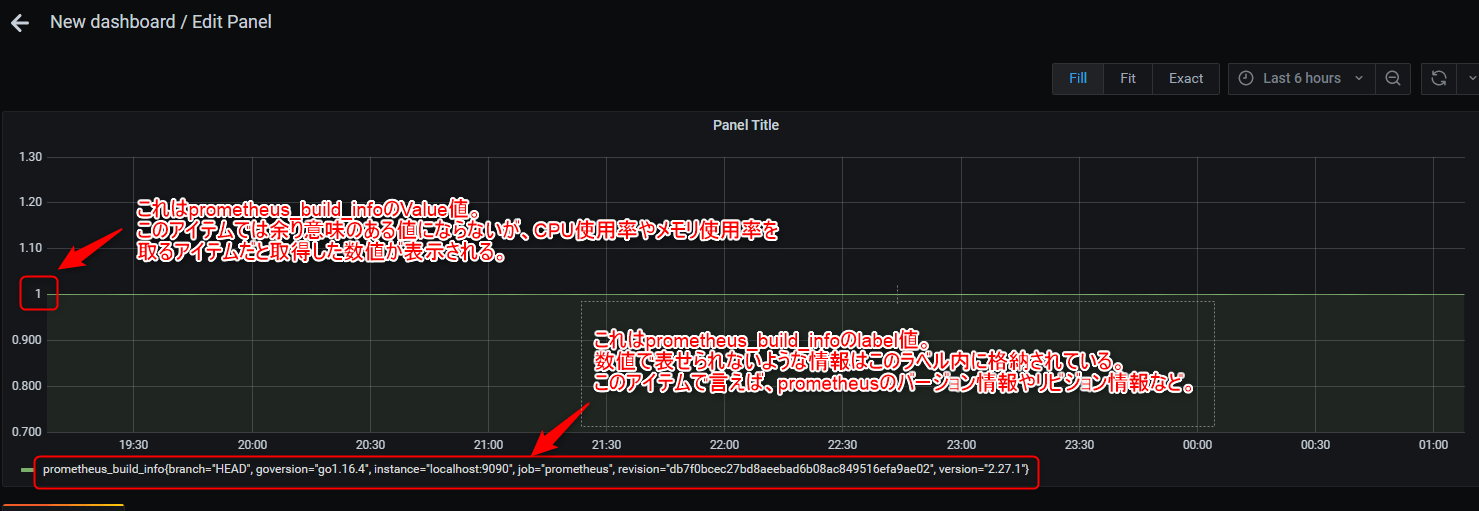
「グラフ」という形で表示するような情報ではないが、Grafanaの表示形式を変えてやるとテキスト形式や表形式で表示させることが可能。


Panel(パネル)の作成が出来たら、右上のApplyをクリックして保存する。

最後にダッシュボードそのもののセーブも忘れないようにする。

好きなダッシュボード名をつけてSaveをクリックする。Folderはダッシュボードの管理フォルダの指定。こだわりがなければGeneralのままでOK。

以上でダッシュボードの作成は終了である。
後書き
次回は vCenterの情報をPrometheusで取得し、Grafanaで表示する方法です。ではでは。

改版履歴
2021/7/16 初版作成


コメント